


- Over 60% of UK workers skipped some annual leave across 2022 and 2023.
- Around 1 in 10 blamed pressure from management for unused allowance.
- Germans lead longer breaks, with 70% taking a full week off.
Annual Leave in a Nutshell
Did you know that:
- Just under 61% of workers didn’t take all of their annual leave in 2023 compared to 62% of workers in 2022.
- Fewer than 1 in 6 UK employees got paid for unused annual leave in 2023, compared to roughly 1 in 5 in 2022.
- Around 1 in 10 UK workers in 2022 and 2023 say they didn’t take all of their annual leave because they felt pressured by management
- Less than a third of US employees have had a whole week off work in the last year, this did not change between 2022 and 2023
- New mums in the UK booked between 10 and 11 weeks off for maternity leave on average in 2023, compared to 11 weeks in 2022. Whilst those in the US took more in 2023 than in 2022, increasing from an average of just under 5 weeks off to over 6 weeks.
- Only 7% of workers in the UK took compassionate leave in 2023 compared to 8% in 2022.
- In 2022, women were far more likely than men to use all of their annual leave (50% vs 28%). This was still true in 2023, however the gap had narrowed to 45% vs 34%
What percentage of people use their annual leave allowance?
In December 2022 and then again in February 2024, we surveyed around 1,500 working UK adults to find out how much annual leave they’d left unused over the previous 12 month period. These surveys were conducted using Censuswide and both found that:
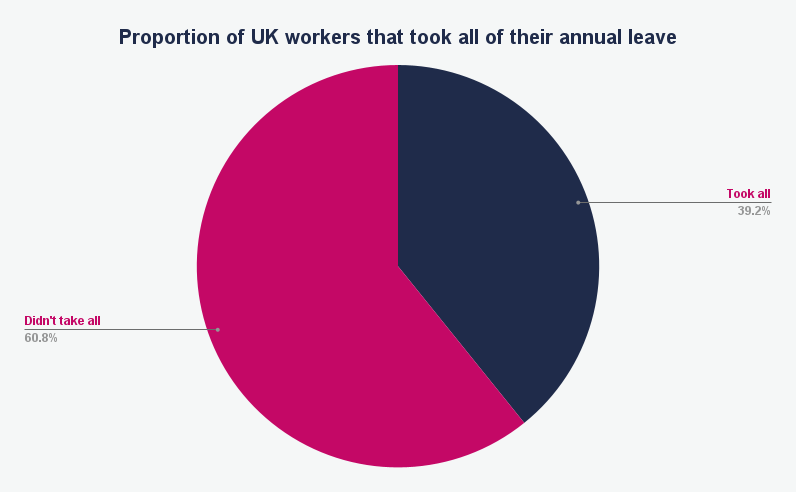
- Less than 40% of UK adults took all of their annual leave allowance in 2022 and in 2023.
- The majority (over 60%) of UK workers didn’t take all of their holiday allowance.
- This means that over 18 million of the UK’s 29.7 million workers didn’t take the amount of leave they were entitled to in 2022 and 2023.
The chart below shows the percentage of people who took all of their yearly annual leave allowance over the last 12 months vs those who didn’t.
Most common reasons why UK workers don’t use their annual leave
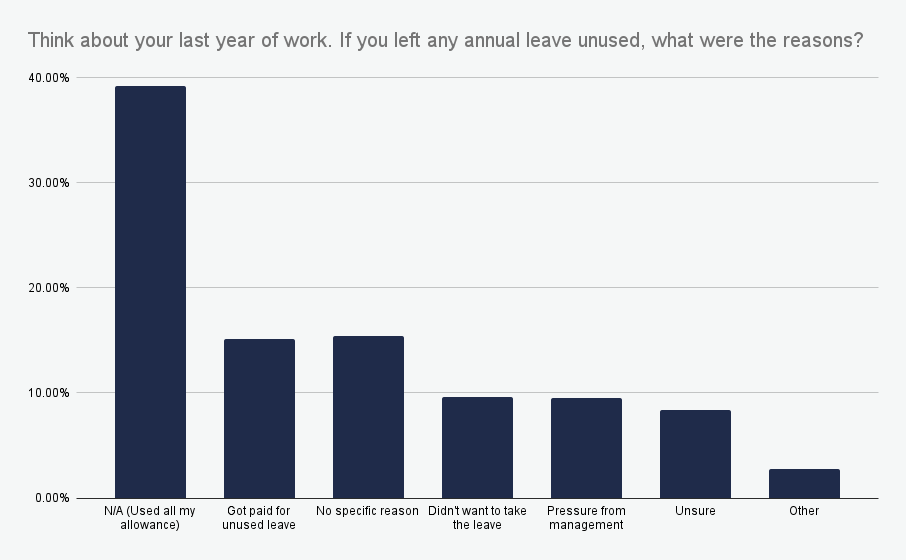
Our surveys also asked respondents for the reasons why they didn’t take all of their annual leave allowance in the last year, posing the following question and answer options:
Think about your last year of work. If you left any annual leave unused, what were the reasons? (Tick all that apply):
- N/A - I used all my allowance
- I got paid for unused leave
- No specific reason
- Didn't want to take the leave
- Pressure from management
- Unsure
- Other
The findings revealed that:
- The most common reason why employees didn’t take all of their annual leave last year was because they got paid for any unused time off (15.14% in 2023 vs 18.6% in 2022).
- Nearly 16% say there’s no specific reason, and - believe it or not - another 10% said they did not want to use their annual leave allowances!
- At the same time, around 1 in 10 UK workers sadly said that the reason they didn’t take their full annual leave last year was because they felt pressure from their management. (10.46% in 2022 and 9.48% in 2023)
Are men or women more likely to use their leave allowances?
Our surveys found that:
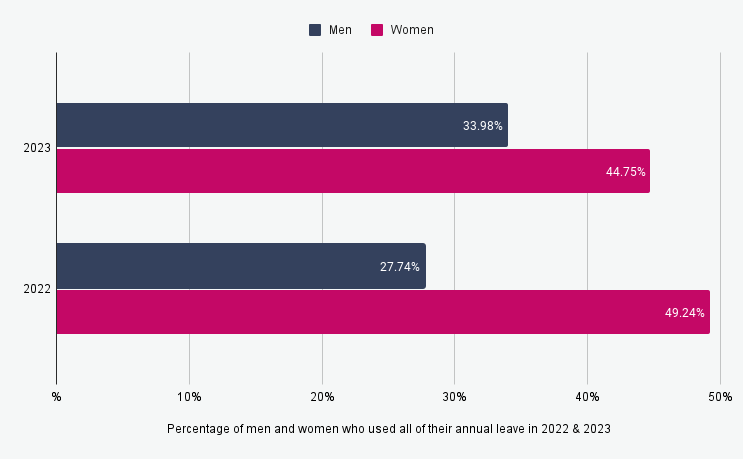
- Women were almost twice as likely to use all of their annual leave than men in 2022. Compared to 2022, fewer women and more men used their full allowances in 2023. Women were still 30% more likely to use all of their allowances in 2023.
- As you can see from the graph, 49.2% of women used all of their leave allowance in 2022 compared to 44.75% in 2023
- Whilst just 27.7% of men used all of theirs in 2022, compared to 33.98% in 2023
Which age groups are most and least likely to use all of their annual leave?
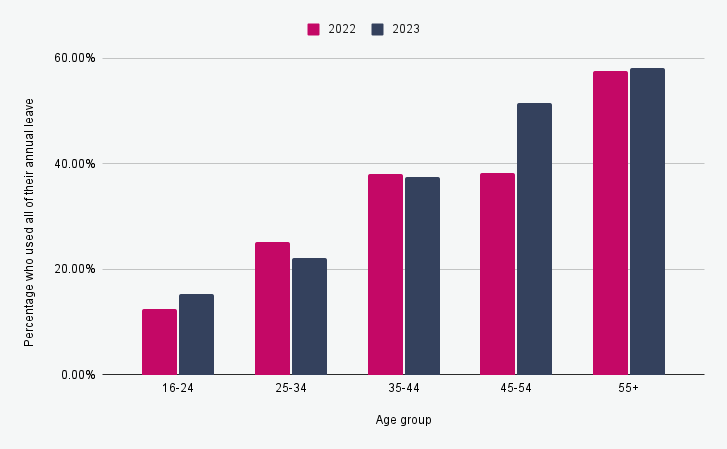
Breaking things down by age, we see that:
- UK workers aged 45 and over are the most likely to use all of their annual leave allowance. More than half of those in this age category say they used all of their leave in 2023. In 2022, only those aged 55+ used more than half of their leave - the 45-54 age group reached 50% for the first time in 2023
- Younger workers in the 16-24 age group tend to use less of their holiday allowances - although this increased in 2023 (15%) compared to 2022 (12%)
- As you can see from the graph, less than half of people aged between 18 & 54 used all of their annual leave.
Which UK regions take the most annual leave?
Throughout the UK regions, there are some significant differences in the amount of annual leave people took in 2022:
- Three regions of the UK used most of their annual leave: South East, South West and Yorkshire and the Humber, each using 47%, with Scotland close behind on 46%. With the exception of the South West, whose percentage dropped from 50%, the other three saw increases in 2023 - South East (36% > 47%), Yorkshire and the Humber (38% > 47%), Scotland (41% > 46%).
- Whilst the region that’s least likely to use all of their leave remained the same in 2023 as it was in 2022. That region is London, where only 22% of workers took the leave they were entitled to - this was still a slight increase from 2022, when only 20% of workers took their full allowance.
The maps below show each UK region and the proportion of people who used all of their leave, as well as the proportion of those who were paid for unused leave in both 2022 and 2023. Use the drop-downs to compare each region between 2022 and 2023.
Who’s more likely to be paid for unused annual leave?
Our findings revealed that when it comes to those who did not use all of their annual leave allowances:
- Men were slightly more likely than women to be paid for unused leave in 2023
- 17% of men said they’ve been paid for their unused leave in 2023
- Whilst only 13% of women said the same.
- The number of men being paid for unused leave dropped by around 8 percentage points from 25% to 17% between 2022 and 2023 whilst the number of women saying the same increased slightly from 12% to around 13% in the same period.
Our survey also found that the age groups that are least likely to use all of their leave are also the most likely to be paid for unused leave.
Which day of the year do most people book off work for their annual leave?
So we know the reasons why people don’t always use all of their annual leave allowances. But when it comes to the leave we do take - which date is most popular? Is it during the summer when people's children are off school and they’re jetting off to sunny destinations as a relaxing break from work? Or is it closer to the end of the year in the lead up to Christmas, when many of us make plans with family and friends and have some days left to use up?
To find out, we conducted an analysis of the Timetastic database, which contains annual leave data from approximately 250,000 users. Our analysis found that:
- The most popular day that people take off work tends to be between Christmas and New Year.
- The day people are least likely to book off work tends to be in January, the only exception to this was 2020 when the least popular day was in April.
What’s the most popular day of the week for annual leave?
Perhaps unsurprisingly, our analysis found that Mondays and Fridays are the most popular days of the week people book off for annual leave. This is very likely to be due to people wanting to take long weekends away or simply extending their weekends by a day.
Which countries take the most annual leave at a time?
Taking a few days off for a long weekend here and there is great, but many people find that it’s difficult to fully switch off from work and recharge without having at least one full week off. To find out just how common it is for people to take a week or more off work at a time and to see which countries do this most often, we analysed Timetastic user data in countries that have 800 or more users of the platform.
The analysis looked at data from employees in the UK, Ireland, Spain, the US, Netherlands, Germany and Australia and found:
- Germans are still the biggest fans of longer breaks from work, with over 70% having taken 1 week or more off work in the last 12 months, compared to 69% in 2022.
- This is closely followed by the Netherlands, where 65% have taken at least 1 week off over the past year, an increase from 57% in 2022.
- Switzerland, Ireland, the UK, the UAE, Australia and Spain are also amongst the countries that take the most leave at a time. More than 50% of users in each of these countries took at lest one full week off in 2023.
- Whilst the US falls behind the rest, with less than a third (31%) of workers having had a whole week off work in the last year.
So why is this? What factors influence the number of days leave we take off at a time?
Well, it’s difficult to say exactly - but one thing we do know is that the countries where people take more leave at a time (such as Germany and the Netherlands) have some of the highest minimum paid holiday allowances worldwide. Whilst the number of days paid leave entitlement in countries such as the US and Canada are much lower (or even non-existent!)
- As you can see from the graph below, the country where workers are least likely to take a week or more off work is the US, as less than a third of people say they’ve done this in the past year. US workers also have zero days minimum paid holiday allowance.
- In contrast, over two thirds of German workers have taken a week or more annual leave at a time over the last year, with Germany having a generous 30 days minimum paid holiday allowance per year.
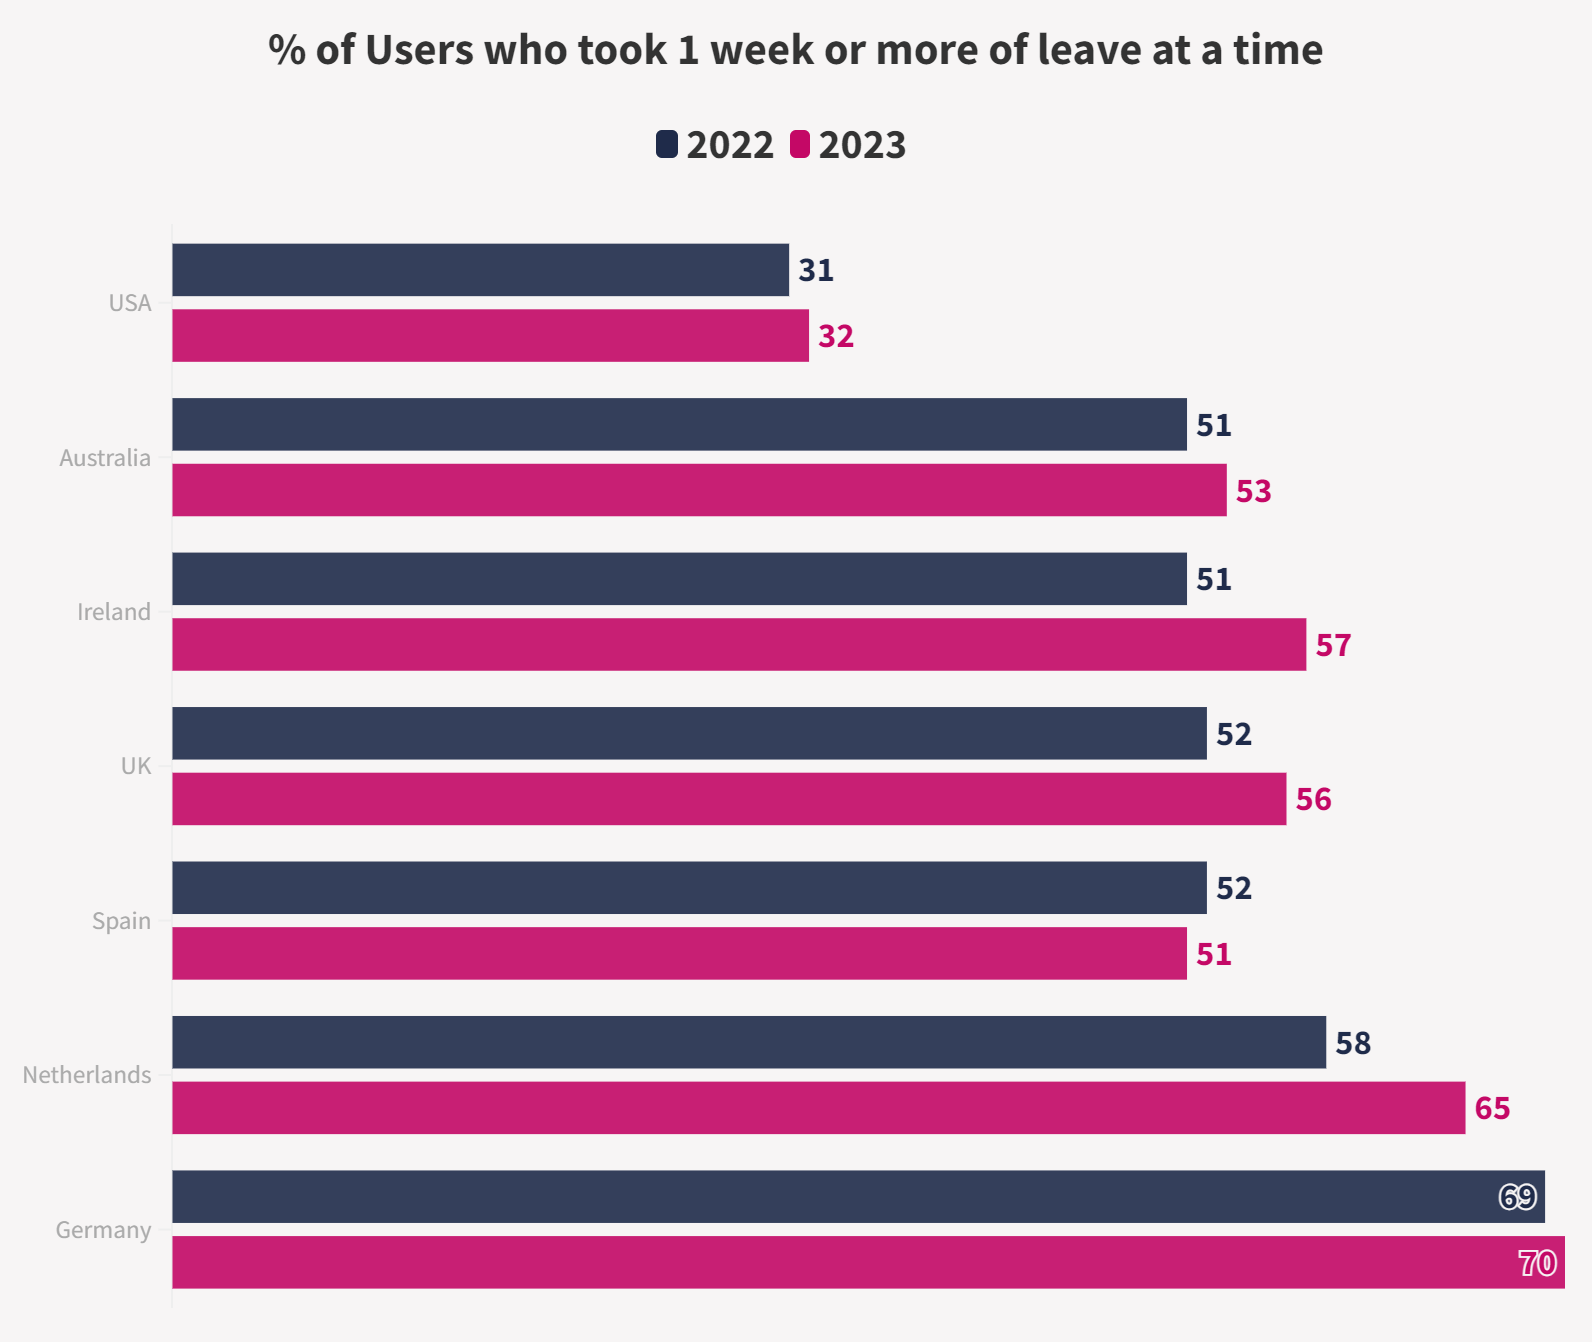
The graph above shows the following data:
Maternity Leave Statistics
So how about maternity leave? How does the amount of leave new mums take differ from country to country?
Our analysis found that:
- On average, new mothers in 2023 took between 10 & 11 weeks off (75 days) at a time when booking maternity leave. This represented an increase of 10 full days on the figures from 2022 (65 days)
- Mothers in the UK book, on average, between 10 and 11 weeks at a time maternity leave
- Whilst in the US, mothers now take on average just over 6 weeks - compared to under 5 weeks in 2022.
As you can see from the table, mothers in the USA have no statutory entitlement to maternity leave. This could explain why there are so few bookings per user and the booking lengths are less than half that of the UK.
*small sample of 451 users
**shared between both parents
Paternity Leave Statistics
So how about paternity leave? It may not surprise you to find that new Dads will typically take far less paternity leave than new mums take in maternity leave. But how big is the difference?
Our analysis found that:
- On average, new fathers take 13.93 days paternity leave (across users in all countries) but this is heavily weighted to the UK
- Fathers in the UK specifically book, on average, 16.5 days - this is down by one day on figures from 2022.
- According to findings by People Management, only a third of fathers take paternity leave in the UK (204,000 paternity leave claimants in 2021-222 vs 636,000 maternity leave claimants)
The fact that Paternity leave is so weighted to the UK perhaps reflective of the 2 weeks ordinary paternity leave that new fathers are allowed to take.
Adoption Leave Statistics
There is hardly any leave classified as adoption leave in our data set. Here are the key figures:
- Fewer than 0.05% of users have taken Adoption Leave
- Those who do take Adoption Leave take an average of just 62 days
This is despite the fact that you have the same leave allowance in the UK for adoption as you do for maternity/paternity.
But can we explain these figures?
Well, this is likely to be down to the fact far fewer adoptions take place than births.
In 2023 there were 2,960 adoptions (2% decrease from 2022) vs 605,479 live births in the UK in 2022
There are around 205 live births for every adoption in the UK. If you add adoptions and births together, adoptions make up less than 0.5% of the total number. This can help explain why there are so few requests for adoption leave.
Bereavement and Compassionate Leave Statistics
Around 7% of our users (17,135 users) have taken compassionate leave or bereavement leave in the last 12 months. This represents an increase of about 11% of the number of people taking bereavement or compassionate leave in 2023 compared to 2022.
In terms of the law in the UK, there is no statutory entitlement to compassionate leave except in the specific circumstances of the death of a child.
Here are the key statistics surrounding compassionate leave:
- 7% of our users have taken compassionate or bereavement leave in the past 12 months.
- 11% more users took compassionate leave in 2023 compared to 2022.
- The average length of time taken off is around 1.6 days
Individual days off for funerals are likely to be classified as compassionate leave as well.
Conclusion
What’s clear from our 2023 State of Annual Leave analysis is that more flexible statutory leave allowances (unsurprisingly) result in people taking more time off. Yet even when annual leave is a requirement, not everyone uses their whole allowance for a whole host of reasons.
Overall, there has been very little change in the overall number of people using all of their annual leave allowance between 2022 and 2023 - with that number staying at around 39% for each of those 2 years.

.avif)


200,000+ people book their time off here
Set it up for your team before the next request lands.